The UBI Lab Network's Resilience UBI proposals
Explore their Covid Dividend and Full UBI plans in PolicyEngine
Last month, the UBI Lab Network announced their proposal for a ‘Resilience UBI’. In an op-ed for OpenDemocracy, the proposal’s lead author Patrick Brown wrote:
We want to give every working-age adult (16-64) resident in the UK £400 a month for a year – no strings attached. We also want to give all children and pensioners £200 a month. This would be without any changes to existing benefits or the State Pension.
Brown continued:
The Resilience UBI would initially last for a year, but it could be extended depending on the circumstances of the pandemic. In our full proposal paper, we’ve also outlined how it could be transitioned into a permanent Universal Basic Income for everyone.
We worked with the UBI Lab Network to estimate the impact of their plan, which encompasses three policies:
- A ‘Covid Dividend’ as described in Brown’s op-ed
- A ‘Full UBI’ which provides a more generous UBI funded by tax and benefit reforms
- A ‘Transitional UBI’ which transitions from the Covid Dividend to the Full UBI
As Brown wrote:
We’ve teamed up with PolicyEngine UK, which models the effect of proposed policy changes on the economy, to crunch the numbers. Its modelling of our Resilience UBI shows that overall poverty would fall by 80%, and child poverty by 85%. It also found that the lowest earners would be the biggest winners. It’s even created a tool so that you can see the effect the Resilience UBI would have on your own household.
The Resilience UBI website also embeds PolicyEngine’s household page for users to calculate a personalized impact of the Covid Dividend.1 Here are high-level results from our analysis, though we caveat that PolicyEngine only models about two thirds of the Full UBI’s funding provisions.
| Policy | Net cost | Poverty reduction | % coming out ahead |
|---|---|---|---|
| Covid Dividend | £266bn | 77% | 100% |
| Full UBI (PolicyEngine only) | £222bn | 84% | 89% |
| Full UBI, with non-PolicyEngine provisions | £55.5bn | ? | ? |
In this report, we describe the features of the Resilience UBI’s Covid Dividend and Full UBI policies, how we modelled them, PolicyEngine results, and some supplementary analysis to fill in the gaps of our formal modelling.
The Resilience UBI
The UBI Lab Network’s full paper describes the Resilience UBI proposal in greater detail than the website or the op-ed:
- The Covid Dividend provides £400 a month to people aged 16 to 64, and £200 a month to others (children and pensioners). It would last a year and not alter existing taxes or benefits, instead being funded through money creation. The UBI would not be counted for means-testing or taxation.
- The Full UBI provides £800 a month to people aged 16 or older, and £400 a month to children. It also would not be counted for means-testing or taxation. On the income tax and National Insurance side, the cost would be offset by abolishing the Personal Allowance, adding 15 percentage points to each Income Tax rate, and flattening National Insurance rates for employees and self-employed people to 10%. The Full UBI plan also abolishes State Pension and all means-tested benefits, except those related to housing and disability. Finally, the plan calls for other tax reforms: raising VAT and Corporation Tax by 5 percentage points each, enacting a ‘Tobin Tax’ form of a Financial Transactions Tax, and levying a wealth tax.
PolicyEngine analysis
PolicyEngine supports most of the income tax and benefit reforms proposed in the Resilience UBI plans, with these exceptions:
- For the Covid Dividend, PolicyEngine defines pensioner as State Pension Age or above, rather than age 65.
- For the Full UBI, PolicyEngine doesn’t currently support VAT, Corporation Tax, wealth tax, or financial transaction tax reforms.
Given those caveats, we estimate the cost of the Covid Dividend at £266bn, two percent higher than the UBI Lab Network’s £261bn.
Among the Full UBI provisions that PolicyEngine can model, the UBI Lab Network estimates a net cost of £186bn, while PolicyEngine estimates £222bn. As shown in this table (in £bn), PolicyEngine estimates similar cost of the UBI itself, and less revenue from all funding provisions except the new Income Tax bands:2
| Element | UBI Lab Network | PolicyEngine | Difference |
|---|---|---|---|
| Full UBI | (580) | (585) | -5 (1%) |
| Savings from current welfare programmes | 170 | 131 | -39 (23%) |
| Scrapping Personal Tax Allowance | 111.2 | 85 | -26.2 (24%) |
| New Income Tax bands | 82.5 | 141 | +58.5 (71%) |
| New NIC bands | 30 | 6 | -24 (80%) |
| Net budget impact of PolicyEngine provisions | (186.3) | (222) | -35.7 (19%) |
See Appendix A for explanations of these differences.
Keeping the £222bn deficit in mind, the Full UBI cuts poverty by 84%, including all but eliminating child poverty.
It nearly triples the bottom decile’s net income, and leaves each of the bottom nine deciles better off, on average.
About nine in ten people come out ahead, and five in six gain at least 5%. Other than the bottom decile, nearly all of whom come out ahead, less than one in ten people in each of the bottom nine deciles are worse off.
Sample households
Consider a family with two parents, each earning £20,000, and two children. PolicyEngine shows that their net income would rise by £16k (45%). While their taxes rise by £11k, their benefits (including UBI) rise by £27k.
They’d continue to be better off until their income exceeds about £153k.
They’d continue to be better off until their income exceeds about £153k. The reform would also simplify their marginal tax rate schedule, making it monotonically progressive. Currently, this family faces their highest marginal tax rates when their combined income is below £28k, losing 63p of every marginal £1 due to Universal Credit withdrawal. Their marginal tax rate jumps around nine times before landing on the 47% top rate. Under the Full UBI scheme, their top marginal rate rises to 70%, but it gets there steadily from 35% and only once their income exceeds £170k.
Since the policy is not budget-neutral, most families would experience gains like these, and most would also see more predictable work incentives as above.
PolicyEngine’s budget-neutral Full UBI
As shown above, the Full UBI of £800 a month for adults and £400 for children, combined with Income Tax, National Insurance, and means-tested benefit reforms, would leave a £222bn net cost. What if the UBI is shrunk to be budget-neutral?
Retaining the same ratio of adults getting double the amount of children, these revenue sources would fund about £250 a month for children and £500 for adults (£57 and £114 a week, respectively). Setting a single UBI without separating by age would yield about £450 a month (£103 a week).
| Full UBI version | Budget impact | Poverty | Senior poverty | Winner share |
|---|---|---|---|---|
| £800/mo adults, £400/mo children | (222bn) | -84% | -45% | 89% |
| £500/mo adults, £250/mo children | 1bn | -26% | +75% | 62% |
| £450/mo all | 1bn | -34% | +96% | 61% |
Poverty falls substantially in both budget-neutral versions—especially when children receive a full share—and most come out ahead. However, senior poverty also rises substantially. The Resilience UBI authors set the Full UBI adult roughly to replace the full new State Pension of £179.60 per week. Continuing to fully repeal State Pension while shrinking its replacement leaves many pensioners worse off, demonstrating the importance of making UBI generous if it’s to replace large benefits.
Provisions PolicyEngine doesn’t model
Wealth tax
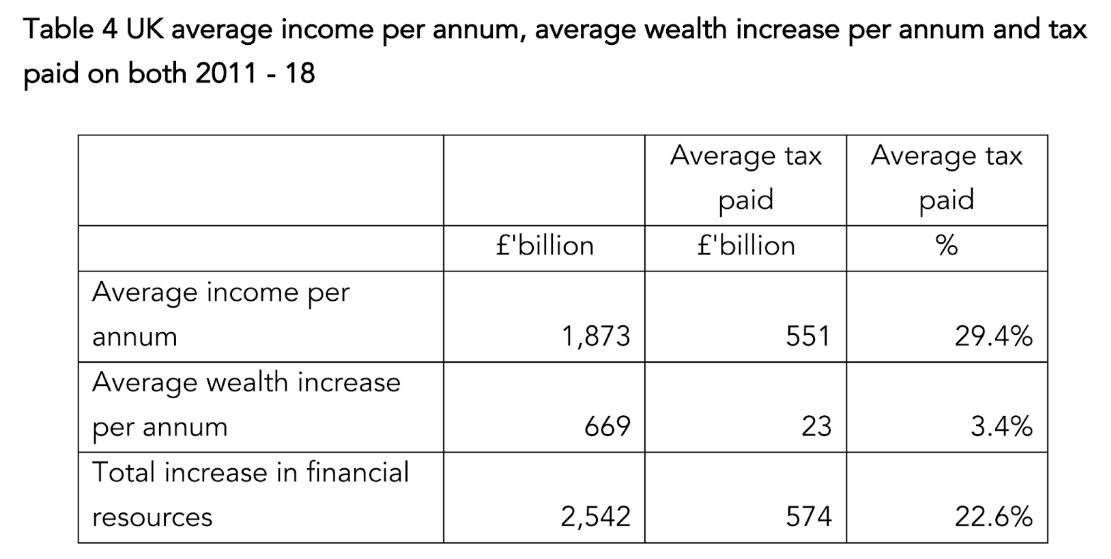
Of the Full UBI provisions omitted from our PolicyEngine analysis, the largest is the wealth tax, which the Resilience paper estimates could raise £116bn per year. The UBI Lab Network bases this figure on a 2020 analysis from Richard Murphy, who finds that “if increases in wealth had been taxed at the same rate as income then an additional £174 billion of tax revenue might have been raised in the UK each year.” They then scale that down by a third to arrive at £116bn.
As shown in the table below, Murphy finds an effective tax rate on income of 29.4% from 2011 to 2018, and an effective tax rate on wealth increase of 3.4%.
Murphy adds caution to his results:
Whether or not it would be desirable, or even technically feasible, to raise £174 billion of additional tax from additional tax charges on wealth is not the primary issue addressed by this paper. Nor does it concern itself with the issue of whether that sum should be redistributed simply to redress wealth inequality. A value judgement is not being offered here on the matter of wealth holding, as such. Instead the issue of concern being addressed is that those most vulnerable to precarity within the UK are also those paying the highest overall effective rates of tax.
£116bn is 0.8% of the total net wealth of private households from 2016-2018, £14.6tn. Raising that revenue from wealth taxes would require an unprecedentedly broad base and high rates. According to the Wealth Tax Commission Tax Simulator, a wealth tax with no exemption could raise £113bn per year if levied at 0.8% and zero avoidance is assumed.3 That means an extra 0.8% per year property tax for every homeowner, as well as a tax on all equities, vehicles, and other assets.
As a benchmark, Norway’s wealth tax levies a 0.85% tax on wealth above 1.5 million NOK (£130,000), or 3 million NOK (£260,000) for married couples. Norway also taxes primary residence at a quarter of their market value. The WTC Tax Simulator can approximate Norway’s structure with a 0.9% tax on wealth above £250,000, which yields £78bn per year when assuming no avoidance (there’s no option to reduce the value of primary residences). This falls to £69bn when assuming avoidance rates in line with the empirical literature.4 Raising £117bn under these assumptions would require a 1.7% tax rate.
As we explored in our land value tax report, funding transfers with taxes on assets can push some the interaction of wealth and income could yield counterintuitive distributional impacts depending on measurement, with a wealth-tax-funded UBI pushing some high-asset low-income pensioners into poverty. Nevertheless, while it would be unprecedented for a wealth tax to raise £117bn per year, the Resilience UBI proposal leaves the door open for unprecedented actions, so it does seem to be possible.
Close tax loopholes
In its section titled ‘Close tax loopholes’, the Resilience UBI report states:
The figures on the amount lost each year in tax varies widely, with HMRC estimating it at just over £30bn per year and some commentators estimating it as high as £90bn, depending on which legal and illegal means of paying less tax are considered.
HMRC’s latest estimate of the ‘tax gap’ is 35bn, reflecting data for the 2019-2020 fiscal year. They define it as ‘the difference between the amount of tax that should, in theory, be paid to HMRC, and what is actually paid.’
The £90bn figure comes again from Richard Murphy, in a 2019 blog post. Here are the differences in £bn:
| Component | HMRC | Murphy |
|---|---|---|
| Domestic evasion5 | 20.4 | 71.7 |
| Avoidance6 | 7.3 | 11 |
| Non-payment | 4 | 3.4 |
| Error | 3.7 | 3.2 |
| Total | 35.4 | 89.3 |
| Total excl. avoidance | 28.1 | 78.3 |
Avoidance results from tax laws rather than enforcement. Since the Resilience paper does not specify tax reforms in this section, the core difference with respect to enforcement is the sum of domestic evasion, non-payment, and error. HMRC estimates that these categories sum to £28.1bn, a third of Murphy’s £78.3bn.
Murphy’s biggest difference from HMRC is the estimate of domestic evasion. Rather than HMRC’s bottom-up approach of comparing records for specific industries, Murphy assumes that the shadow economy represents 10% of GDP,7 and multiplies that 10% by the 33.1% average tax to GDP share. Murphy based his estimate of a 10% shadow economy on (a) the VAT tax gap at the time (now 8.4%), (b) an IMF paper estimating an 8.3% shadow economy as of 2015, (c) the EU’s estimate of the VAT gap as 10.9% in 20158 (12.2% as of 2018), and (d) Raczkowski (2015)’s estimate of a 9.7% total tax gap as of 2014.
A 10% shadow economy therefore seems plausible, though Murphy’s approach may overstate the tax gap because participants in the shadow economy could have lower incomes. This would assign them lower effective tax rates if the tax gap were closed, due to progressive taxation.
Additional resources—the Resilience paper proposes reassigning DWP workers to HMRC enforcement, for example—can plausibly shrink the tax gap by reducing evasion, errors, and non-payment. However, it’s unlikely that even significant additional resources could close the tax gap entirely. In 2016, HMRC celebrated enforcement actions raising £250 million, less than 1% of the total tax gap that year. The US government estimates that significant investment in US tax enforcement can close about 10% of the US tax gap in the next decade.9
Overall, we expect that HMRC more accurately captures the tax gap, and that additional enforcement could close it by the 10% estimated in the US. This comes to £2.8bn per year.
VAT
The standard VAT rate is currently 20%, and the Resilience UBI paper proposes raising it to 25%. The paper does not mention increasing the reduced rate of 5% for domestic fuel and power, children’s car seats and some other goods.
The Office for Budget Responsibility reports that “in 2019-20 VAT raised £134 billion”. They also find that around half of household expenditure is subject to the 20% rate, 3% is subject to the 5% rate, and the remainder is exempt or ‘zero-rated’. That indicates that £664 billion of household expenditure was subject to the 20% rate. Raising the standard VAT rate to 25% would therefore raise £33.2bn, 21% more than the £27.5bn estimated in the Resilience paper. Increasing the reduced rate from 5% to 10% would raise an additional £2bn.
Corporation Tax
While the Resilience UBI paper explores a number of Corporation Tax reforms, such as variable rates based on codetermination, wages, and local investments, as well as adding a Robot Tax, Carbon Tax, or Data Tax, its core proposal is a “5% net increase in the overall Corporation Tax rate”, implying a rise from its current 19% to 24%. Based on the current revenue of £55bn,10 they estimate that this would raise £14.5bn.
However, Corporation Tax is already slated to rise from 19% to 25% for corporations with profits above £250,000 in 2023, and corporations with profits between £50,000 and £250,000 will see their rate rise on a sliding scale from 19% to 25%. The Office of Budget Responsibility estimates that this will raise £11.9bn in 2023; dynamic responses cut this 14% below their static estimate of £13.9bn.
Further raising Corporation Tax to 30% would push the UK above the average Corporation Tax rate among peer countries, which is generally around 27%. As a result, corporations would benefit more from shifting operations and profits to other countries, and the revenue opportunity would shrink.
Conservatively applying OBR’s 14% haircut, we estimate that the tax would raise £12.5bn rather than the static estimate of £14.5bn.
Financial Transactions Tax
The Resilience UBI paper says of the Financial Transactions Tax (FTT):
…the Labour Party’s 2019 manifesto references plans for additional UK based FTT on foreign exchange which the party estimates could raise as much as £8.8bn. However, other sources put this figure as low as £2bn.
They cite an op-ed for the £2bn figure, which then cites an IFS analysis stating that it is “doubtful [the FTT] will raise the £9bn Labour assumes” though not estimating a particular value. In a 2019 article, Josh White says (without providing a source): \
The UK has an SDRT [stamp duty reserve tax] rate of 0.5% on share trading, which raised £3.5 billion ($4.5 billion) in 2017/18. Labour’s proposal would expand this to include transactions involving corporate bonds, equity and credit derivatives, raising an extra £2.1 billion in annual tax revenues.
The Resilience UBI paper ultimately uses £2bn, which seems reasonable.
Bringing it all together
The UBI Lab Network estimates that their entire Full UBI policy would produce a £33.7bn surplus. Adding the PolicyEngine results with separate estimates of provisions not yet modeled in PolicyEngine, we estimate a £55.5bn deficit.
| Element | UBI Lab Network | UBI Center | Difference |
|---|---|---|---|
| Full UBI | (580) | (585) | -5 (1%) |
| Savings from current welfare programmes | 170 | 131 | -39 (23%) |
| Scrapping Personal Tax Allowance | 111.2 | 85 | -26.2 (24%) |
| New Income Tax bands | 82.5 | 141 | +58.5 (71%) |
| New NIC bands | 30 | 6 | -24 (80%) |
| Net budget impact of PolicyEngine provisions | (186.3) | (222) | -35.7 (19%) |
| Wealth Tax | 116 | 116 | - |
| Close tax loopholes | 60 | 2.8 | -57.2 (95%) |
| VAT increase | 27.5 | 33.2 | +5.7 (21%) |
| Reform Corporation Tax | 14.5 | 12.5 | -2 (14%) |
| Financial Transactions Tax | 2 | 2 | - |
| Net budget impact of non-PolicyEngine provisions | 220.0 | 166.5 | -53.5 (24%) |
| Net combined budget impact | 33.7 | (55.5) | -89.2 |
Conclusion
The UBI Lab Network’s Resilience UBI is among the more comprehensive UBI plans put forth. Its Full UBI incorporates a range of revenue sources that nearly meets the tall task of funding a generous UBI. Even budget-neutral versions of the plan, limiting to PolicyEngine capabilities, reduce poverty by at least a quarter and benefit most UK residents.
And yet, even with generous assumptions, we estimate that it falls short by over £50bn. This can be fully explained by a £57bn gap in estimated revenue from closing tax loopholes (a relatively subjective reform), though other assumptions like savings from welfare programs (which PolicyEngine measures precisely) also play a part.
In the future, PolicyEngine will support modelling more components of this policy, such as the VAT increase and a wealth tax. While that full analysis will clarify these points, one area of potential concern is pensioner impact. Budget-neutral versions of the Full UBI left pensioner poverty rising 75-95%, as the UBI failed to cover State Pension. The true Full UBI cuts pension poverty 45%, but the VAT and wealth tax could offset that. As we showed in our land dividend report, some low-income pensioners have enough wealth for taxes on wealth or components of it (such as land) can exceed UBI payments, especially at the high rates needed to raise £116bn per year. Similarly, pensioners continue to consume goods and services subject to VAT. Fully modelling this out may justify optimising the UBI amount, as we did in our Blank Slate UBI report, which provided a larger UBI to pensioners than to working-age adults.
Beyond poverty and inequality reduction, the Resilience UBI would have other pros and cons, from a simpler, more streamlined welfare state and more predictable marginal tax rates, to higher average marginal tax rates and increased taxes on production, both of which risk shrinking the economy. Nevertheless, as our Blank Slate UBI paper did six months ago, the UBI Lab Network’s proposal marks an important step in the discussion of how to model a true—and truly funded—universal basic income. We look forward to continuing that discussion in the future.
Appendix A: Differences in revenue estimates
- Personal Allowance repeal: the report gives examples of how the new tax rates and personal allowance repeal would be administered (page 15), which imply that the higher rate threshold will be increased from £37,700 to £50,000 (this would not happen automatically, as the Income Tax rate thresholds are defined over taxable income minus allowances). The New Economics Foundation also costed a repeal of the Personal Allowance (clarifying this mechanic) and found the full repeal without adjusting the higher threshold was £111bn.
- Welfare savings: the report cites the benefit expenditure and caseload tables produced by the DWP, and states that the savings are estimated from £100bn in State Pension payments and £70bn in income-related benefits. However,
- £100bn in State Pension payments is the total amount of gross payments, not net of income tax repayments. Repealing it would lower income tax revenues, reducing the total revenue raised.
- “Income-related benefits” in the table includes Housing Benefit, as well as Universal Credit. Housing benefit is not repealed by the Resilience UBI plan, but its repeal is included in the costing. Furthermore, the Universal Credit figure is reached by the tables as a composite of working-age Housing Benefit, and other related benefits. It’s not clear whether Resilience UBI would leave in the housing costs element of Universal Credit (we’ve assumed they would).
- National Insurance bands: it’s unclear how the figures were reached in the paper. The paper states: “A flat rate of 10%, for example, would represent a 2% rebate to lower earners, an 8% increase on higher earners and a net increase of 6% in NIC income overall, bringing in approximately £30bn extra a year.” The marginal application of NIC rates is an important detail but isn’t the determinant of the revenue impact.
-
We’re excited that the UBI Lab Network has hosted PolicyEngine’s first external embed, and we invite other organizations to contact us to establish similar partnerships. ↩
-
We simulate provisions of the Full UBI plan in the order shown in the table: UBI only (£585bn), UBI + welfare reforms (£454bn), UBI + welfare reforms + Personal Allowance (£369bn), UBI + welfare reforms + Personal Allowance + Income Tax bands (£228bn), and the fully modeled reform (£222bn). We omit ‘People’s Quantitative Easing’ and ‘Citizen’s Wealth Fund’. ↩
-
£118.5bn when including the ‘rich list’ of UK citizens who may not be residents of the UK, minus £6.0bn per in administration. The Wealth Tax Commission also estimates that this would require a one-time cost of £0.6bn to set up. ↩
-
Table A1 in Penn Wharton Budget Model’s analysis of US Senator Elizabeth Warren’s Wealth Tax shows an average semi-elasticity of taxable wealth of 13. We show results based on the closest value in the WTC Tax Simulator: 12%. ↩
-
We group into a single ‘Evasion’ category HMRC’s behaviours of Failure to take reasonable care, Evasion, Criminal attacks,* and Hidden economy, as well as Murphy’s breakout of Domestic evasion *and *Evasion by wealthy using offshore. ↩
-
We follow Murphy and include in Avoidance the Legal interpretation category, in which HMRC and the taxpayer arrive at different interpretations of laws governing liabilities. ↩
-
Murphy also assumes that this 10% shadow economy is not counted in GDP today. ↩
-
The current EU report shows 9.9% as of 2015 (Table B7). Murphy reports 10.88% for the same source in his 2019 report (Table 5). ↩
-
The US Treasury Department estimates the current tax gap at about $600 billion. They also estimate that “$80 billion of investment over the coming ten years in enforcement, IT, and taxpayer services [would generate] an estimated $320 billion in additional tax collections over the next ten years” and that “changes to the third-party information reports are estimated to generate $460 billion over a decade.” After the investment, that’s an average of $70 billion per year, or 12% of the current tax gap, which might shrink to around 10% given the projected growth of the tax gap. ↩
-
They cite the 2018-19 Corporation Tax revenue of £55bn. Corporation Tax liabilities remained at that £55bn in 2019-20. ↩
Subscribe to the UBI Center
Get the latest posts delivered right to your inbox