Why some low-income people come out behind in Andrew Yang’s Freedom Dividend
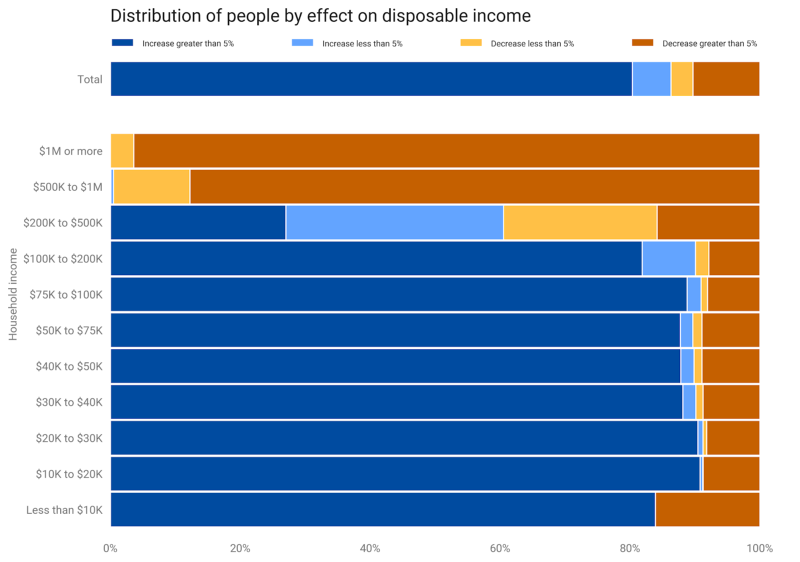
My analysis of Andrew Yang’s Freedom Dividend showed that the plan is progressive: for example, the disposable income of the bottom decile more than doubles, while it falls by 4 percent for the top decile. While the static analysis pegged the deficit impact at $1.4 trillion per year, a revenue-neutral version would also be highly progressive, reducing poverty and inequality.
But statistics like that are averages across tens of millions of people. Another visualization (below) showed that 10 to 15 percent of people in low income households come out behind. Households with income below $10,000 appear especially likely to be worse off. Why is this?
Why people come out behind
Households left worse off by the Yang plan fall into two buckets: those who get the UBI, and those who don’t. Any household that doesn’t get the UBI is left worse off, since they’ll only pay taxes. Some households that get the UBI still come out behind if their taxes exceed the UBI (less benefits they might give up).
So why would households not get the UBI? There are three sub-buckets here:
- Households (tax filing units) with no adults.The UBI is only given to adults. 1.6 million people are in zero-adult tax filing units (4 percent of all who come out behind).*
- Households with no adult citizens.The UBI is only given to adult citizens. 7 percent of Americans are non-citizens, and 23 million people are in households that have adults but no adult citizens (51 percent of all who come out behind).**
- Households that decline the UBI to keep their current benefits.Yang has said that households could keep their current benefits if they want to. I assume that households maximize the value of their benefits, so if they receive more than $12,000 per adult citizen in annual benefits (SNAP, TANF, SSI, and WIC), they decline the UBI. 2.7 million people are in households that decline the UBI (6 percent of all who come out behind).
These estimates warrant a couple wonky caveats:
- “Households” are actually tax filing units in this analysis. The dataset is the Open Source Policy Center’s version of the Current Population Survey, postprocessed in the Tax-Data project to create tax units suitable for tax analysis. This improves modeling of the Yang plan, given its revenue measures relating to the personal income tax code, namely raising the payroll tax cap and treating capital gains as ordinary income. The Current Population Survey itself shows that under 25,000 people are in zero-adult households, indicating that nearly all of the 1.6 million people in zero-adult tax units are children who file taxes separately from their parents. Many of these would therefore still benefit from the Freedom Dividend.
- The dataset powering this analysis didn’t include citizenship status, so I created citizen and non-citizen “copies” of each household, assigning each “citizen copy” a weight of 0.93, and each “non-citizen copy” a weight of 0.07. That means that households are not modeled to include citizens and non-citizens. It also means that the Freedom Dividend’s citizenship requirement affects each income group equally, and 7 percent of each income group would come out behind by default. This is, of course, false, as citizens out-earn non-citizens.
How those reasons vary by income
That said, let’s take a look at how the reasons for coming out behind vary by income:
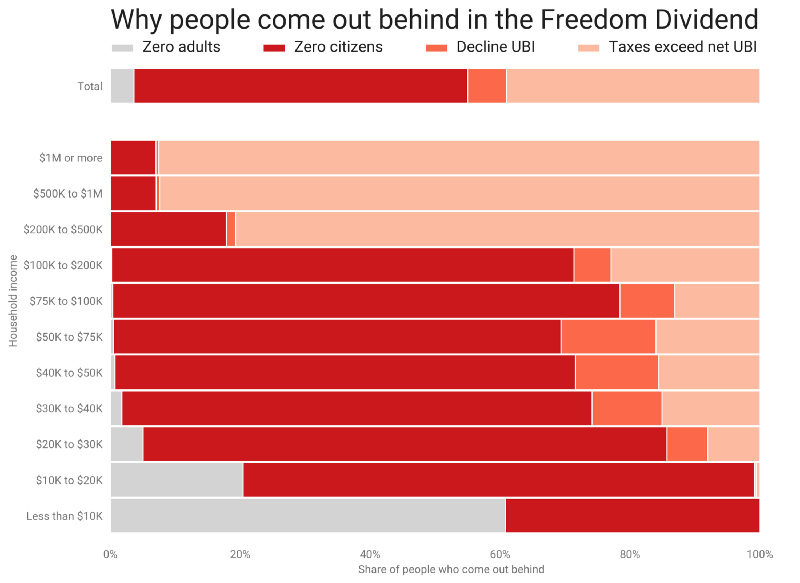
A few insights are evident:
- Most people in “losing” households with income between $10K and $200K are non-citizens. This might even be underestimated given the correlation between income and citizenship not modeled here.
- 60% of people in losing households earning under $10K have no adults in their tax filing unit — an artifact of the data that separates children from adults in the same household and may not reflect a true loss.
- Higher income households are more likely to come out behind because taxes exceed the UBI.
- Benefit clawback hurts a larger share of middle income households than low-income households.
One more caveat: This is not a counterfactual analysis. That is, this doesn’t show the share of people who would no longer come out behind if a policy lever were changed. Including citizens in the UBI wouldn’t make 7 percent of $500K+ households come out ahead, they’d just move to the “Taxes exceed net UBI” bucket.
But at lower incomes, the small “Taxes exceed net UBI” share suggests that removing the citizenship requirement would keep a lot of people from losing money. The dark red at the bottom also suggests that including children would keep low-income households from losing out, though that’s a less binary and more expensive policy choice.
Despite potential controversy over its benefit clawback provision, the feature of Yang’s plan that puts most low-income people behind is its limitation to adult citizens.
Updated 2019–07–15 to include more information on zero-adult households (tax filing units). See this GitHub issue for progress shifting from tax-unit-level analysis to household-level analysis, which will address this.
Subscribe to the UBI Center
Get the latest posts delivered right to your inbox