Introducing the Basic Income Builder
Try the Basic Income Builder at bib.ubicenter.org
Using Python and Plotly Dash’s dashboarding tools, we’ve created the Basic Income Builder: an interactive calculator that uses U.S. Census microdata to simulate distributional effects of a customizable UBI policy program. Users can experiment with a wide variety of inputs, from the size of the and type of taxation to reforms of the existing safety net programs. The calculator then produces interactive data visualizations that allow the user to explore the proposal’s effect on the poverty rate for selected demographics, the poverty gap, and an estimate of what share of individuals come out ahead. Read on for more information, or try it yourself at bib.ubicenter.org.
Background
Our recent research at the UBI Center has demonstrated the remarkable effectiveness of unconditional cash transfers in reducing poverty and inequality across different demographics and regions in the United States. We have found that the UBI shrinks racial poverty and wealth gaps, reduces poverty among people with disabilities, and is more progressive than cancelling student loan debt in terms of wealth inequality.
Inspired by calculators such as Tax Justice Now, UBI Calculator, and PSL’s Tax Brain, and building on our prior work with the UBI Plan Explorer, we created Basic Income Builder, an interactive, customizable policy simulation tool built on our own research on UBI proposals. We sought to create a tool that is useful for policy analysts and policy makers at both the state and federal level, while yielding comprehensible results for a general audience.
As our research has shown that funding Basic Income with a flat tax of 25% or more would reduce both poverty and inequality, we can create a funding mechanism that funds a robust UBI program, but does not require the user to create or adjust complicated income tax brackets.
All code powering this calculator is at github.com/UBICenter/us-calc, and the app is hosted on the open source Compute Studio platform.1
Data
We use three years of data (2017-2019) from the Annual Social and Economic Supplement (ASEC) of the Current Population Survey (CPS). The CPS is a monthly survey of U.S. households conducted by the U.S. Census Bureau and the Bureau of Labor Statistics. The CPS is conducted for the purposes of finding employment and earnings statistics of all individuals 15 and over in the household. Data is reported on the level of the individual persons in the household.
The ASEC provides additional information such as after-tax money income and non-cash benefits. The ASEC also calculates the poverty thresholds for each unit used in our calculations. The ASEC includes all CPS survey respondents in March, with additional oversamples from other months.
The ASEC provides weighted individual and household level economic and demographic variables that we use to determine the total revenue impacts of our available tax, benefit, and eligibility criteria, as well as the impact on poverty and inequality for the entire population, and the impact on poverty rates for a number of selected demographics.
We use the Census Bureau’s Supplemental Poverty Measure (SPM) rather than the official poverty measure. The SPM resource measure is cash income plus in-kind benefits minus non discretionary expenses (including taxes, out of pocket health expenses, and work-related expenses). The SPM poverty thresholds are based on a core of annually updated core expenditures, adjusted for the size of the SPM resource unit and geographical variation in the cost of living.
All of our simulation’s results with respect to poverty are calculated in terms of SPM resources, adjusted for the size of the UBI benefit, as well as any changes to the tax and benefit system selected by the user.
The SPM resource unit is a broadened definition of the traditional Census family of related individuals, expanded to include any cohabiters and their relatives who are likely to share resources. We use the Gini coefficient of SPM resources among SPM units as our primary inequality measure.
Our data is limited in two primary ways:
- The systematic underreporting of means-tested benefits in survey responses; depending on the benefit, up to half may be missing from the Current Population Survey (Meyer Mok and Sullivan 2015).
- The underreporting of incomes above one million dollars, due to the Census Bureau’s income “top-coding” which intends to avoid disclosure of respondents’ personally identifiable data.
Simulation
The user does not select a UBI benefit amount directly – rather, the user selects from a number of budget-neutral “pay-fors”, which produces a benefit size as an output.
On the tax side, users can repeal the personal income tax and the employee-side payroll tax. In addition, there is a slider available for the user to select an additional flat tax of 0% to 50% on all adjusted gross income (AGI) above $0.
On the benefit side, the user can repeal the Child Tax Credit, Supplemental Security Income (SSI), Supplemental Nutrition Assistance Program (SNAP, formerly food stamps), Earned Income Tax Credit, Unemployment Benefits, and the Low Income Heating and Energy Assistance Program (LIHEAP).
Users may also select whether adults, children, and/or non-citizens are eligible for benefits.
We can describe our model as follows, where \(t\) is the additional tax rate (0% to 50%) on all AGI above $0 as selected by user and \(NT_i\) is the value of a new user-specified tax on AGI for SPM unit \(i\):
\[NT_i = t * \max(AGI_i, 0)\]RT is the value of SPM unit’s taxes paid that have been repealed by the user, where IT refers to income taxes paid and PT refers to employee-side payroll taxes. Where \(r_n\) represents a Boolean where a value of \(r_n=1\) indicates that the user has chosen to repeal the benefit, and \(r_n=0\) if not.
\[RT_i = r_{IT}IT_i + r_{PT}PT_i\]We define \(RB\) as the value of SPM unit’s benefits that have been repealed by the user.
\[RB_i = r_{CTC} * CTC_i + r_{SSI} * SSI_i + r_{SNAP} * SNAP_i + r_{EITC} * EITC_i + r_{UI} * UI_i + r_{LIHEAP} * LIHEAP_i\]Thus, the total revenue raised by the user is equal to:
\[Revenue = \sum_i NT_i - RT_i + RB_i\]The new UBI amount paid out to each eligible beneficiary is simply equal to:
\[UBI = \frac{\it Revenue}{\it NumberOfBeneficiaries}\]We then adjust the SPM resources of each unit to account for the new UBI payment, as well as the earlier changes made to taxes and benefits. The new SPM resource amount is expressed by the following equation, where n represents the number of eligible UBI beneficiaries in the SPM unit.
\[NewSPMResources_i = CurrentSPMResources_i + UBI * n_i + RT_i -NT_i - B_i\]We then assign a new value indicating poverty status for each person belonging to an SPM unit where their new SPM resources are below the Census-provided SPM poverty threshold. We then divide the count of all individuals living under this poverty line by the total population.
The poverty gap is the sum of the total amount of additional resources required to lift each SPM unit to the SPM poverty threshold. Using our new SPM resources value for each SPM unit i, we calculate the poverty gap with the following formula:
\[PovertyGap = \sum_i \max(SPMPovertyThreshold_i - NewSPMResources_i, 0)\]Results
To illustrate Basic Income Builder’s capabilities, we present the results of three different budget-neutral UBI reforms. Each reform provides an equal UBI to child and adult citizens.
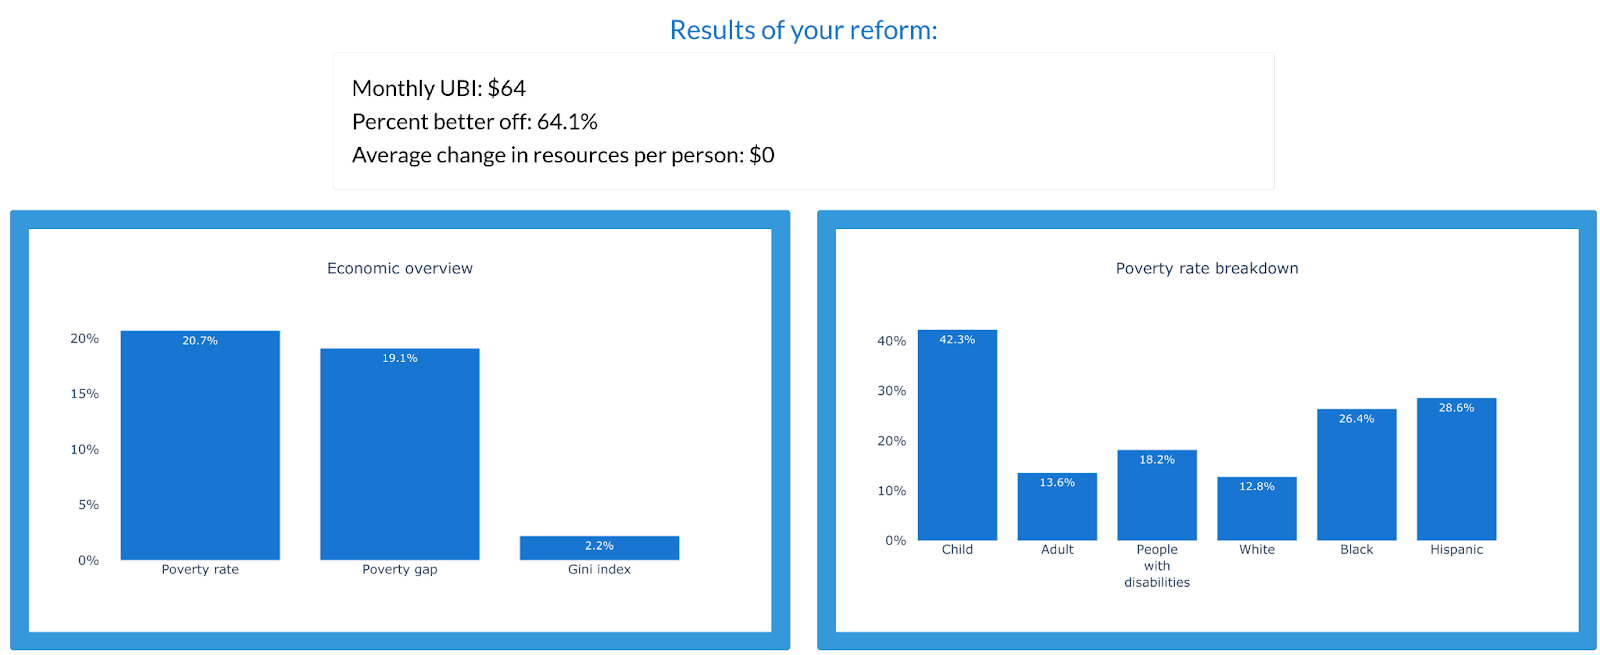
In the first reform, we repeal all six available benefits while holding all else constant; this funds a $64 monthly UBI. To illustrate how our app works in practice, the below screenshot shows the configuration necessary to create this scenario:
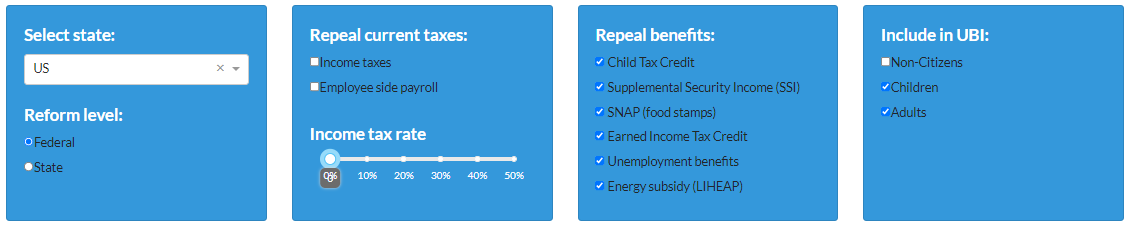
While this leaves most of the population at least slightly better off, it causes poverty and inequality to increase across all categories, as shown by the simulation results below.
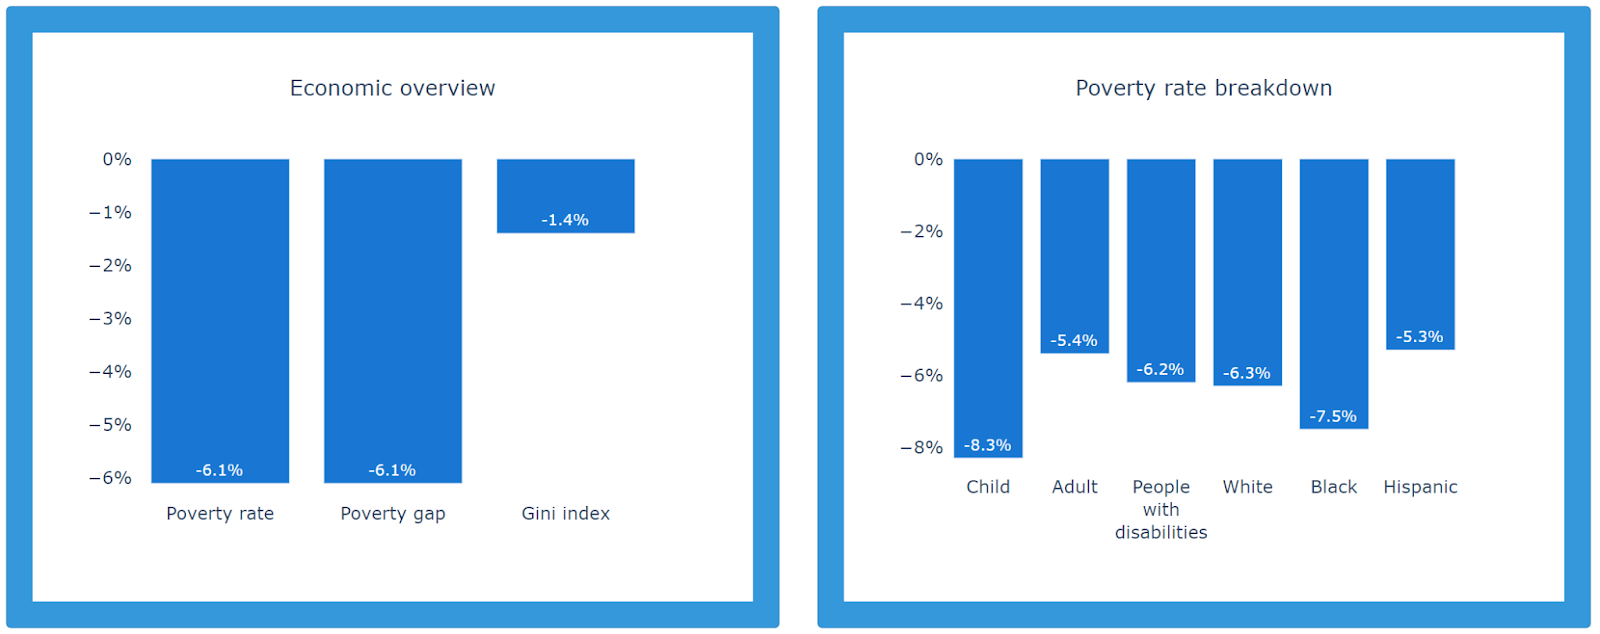
In the second reform, we keep all taxes and benefits as is, but apply an additional 1% income tax on top of the existing system. This funds a $31 monthly benefit, but reduces poverty and inequality across all measures.
Our third reform entails a repeal of the existing income tax system (preserving payroll taxes and benefits), replaced with a 25% flat income tax. This funds a $400 monthly UBI while leaving 51% of Americans better off, while reducing poverty overall by 39% and across each demographic group by between 21% and 55%.
| Baseline | Repeal All Benefits | 1% Income Tax Increase | 25% Flat tax, repeal income tax | |
| Monthly UBI | $64 | $31 | $400 | |
| Share better off | 0.641 | 0.641[^1] | 0.513 | |
| Average change in resources per person | $0 | $0 | $0 | |
| Poverty Gap (Billions USD) | $173 B | +19.1% | -6.1% | -41.7% |
| Gini Index | 0.446 | +2.2% | -1.4% | -8.0% |
| Poverty rate | 0.128 | +20.9% | -6.1% | -38.5% |
| Child | 0.139 | +42.3% | -8.3% | -45.7% |
| Adult | 0.125 | +13.6% | -5.4% | -36.1% |
| People with Disabilities | 0.203 | +18.2% | -6.2% | -55.1% |
| White | 0.089 | +12.8% | -6.3% | -46.6% |
| Black | 0.201 | +26.4% | -7.5% | -52.3% |
| Hispanic | 0.201 | +28.6% | -5.3% | -21.1% |
To demonstrate Basic Income Builder’s state-level capabilities, we return to the reform that replaces existing income taxes with a 25% flat income tax, focusing on North Carolina as an example. When selecting North Carolina from the state menu and leaving everything else unchanged, the calculator shows the effect of the federal reform on North Carolina. The UBI amount is the same ($400 per month), but other distributional effects differ, and we can see that North Carolinians come out ahead by an average of $276 per person per year.
When selecting “State” as the Reform level, the 25% flat income tax instead replaces the North Carolina state income tax. This results in a larger UBI, primarily due to North Carolina’s state income tax raising less revenue than the federal income tax in North Carolina. Consequently, the poverty impacts are substantially greater with this reform, even as it’s no longer a net inflow to the state.
| Baseline (NC) | 25% Flat Tax, Federal | 25% Flat Tax, State | |
| Monthly UBI | $400 | $561 | |
| Share better off | 0.554 | 0.635 | |
| Average change in resources per person | $276 | $0 | |
| Poverty Gap (Billions USD) | $5 B | -44.6% | -58.1% |
| Gini Index | 0.449 | -10.2% | -26.6% |
| Poverty rate | 0.136 | -44.9% | -68.1% |
| Child | 0.149 | -57.8% | -85.6% |
| Adult | 0.132 | -40.9% | -62.5% |
| People with Disabilities | 0.210 | -55.5% | -73.4% |
| White | 0.099 | -49.3% | -69.8% |
| Black | 0.203 | -62.8% | -76.2% |
| Hispanic | 0.198 | +5.1% | -50.2% |
For each of these scenarios, checking the “Children” and “Non-citizens” boxes reveals that including children and non-citizens in the UBI produces larger poverty and inequality reductions. This aligns with other research, such as Ghenis (2020).
Future research
We aim to improve Basic Income Builder in the future in several ways:
- Addressing income data deficiencies by incorporating data from the IRS Public Use File
- Addressing benefit deficiencies by imputing unreported benefits with algorithms like PSL’s CPS Transfer Augmentation Model
- Adjusting for labor supply responses to the changes in the tax code, any effects of repealed benefits on marginal tax rates for low-income individuals, or the income effects of the UBI itself.
- Supporting side-by-side comparison of different user specified proposals.
- Including more tax and benefit reforms on both the federal level, such as repealing deductions.
- Relaxing the requirement for budget-neutrality; instead of determining the UBI amount by changing taxes and benefits, the user could select the desired UBI amount and explore different ways to meet that target.
Conclusion
The UBI Center Basic Income Builder provides users with access to rapid experimentation and analysis to determine the effects of UBI. Some results are intuitive, such as the regressiveness of replacing benefits with UBI without also raising additional tax revenue, while other results may surprise some audiences, such as the large effects on poverty from even modest taxes—even flat income taxes. We hope that this tool and others like it empower the public to learn more about public policy impacts and that they ultimately produce more evidence-based policymaking.
-
We’re grateful to Hank Doupe of Compute Studio for technical assistance and hosting of this app. ↩
Subscribe to the UBI Center
Get the latest posts delivered right to your inbox